Using Amazon Elasticsearch Service
Replacing a self-managed ‘ELK’ stack with ‘The Elastic Stack’, using Amazon’s Elasticsearch Service.
Introduction
I am currently in the process of migrating an ageing self-managed ELK stack from EC2 over to Amazon’s fully-managed Elastic stack. For some context, the ELK stack is a popular collection of open-source tools for logging/application analysis. It is comprised of Elasticsearch, Logstash, and Kibana. Afterwards, Elastic.co introduced Beats (lightweight data shippers) and the stack was renamed to the Elastic stack.
- Beats are single-purpose data shippers
- Logstash aggregates and ingests data
- Elasticsearch indexes the data
- Kibana is a flexible visualisation tool
Motivation
A little background on this one. We’ve recently been spending a lot of time
improving and optimizing our AWS infrastructure. Underutilized resources are being downsized,
heavily used ones are being reserved, and where appropriate, opting for managed
services to replace self-managed EC2 instances.
To date, we’ve been relying on an ageing EC2 instance (m1 generation).
As with all AWS resources, older generations are less performant and more expensive.
Moreover, self-managed servers require maintenance and upkeep, and whilst this
particular server wasn’t too squeaky a door, replacing it with a managed service
removes this potential headache.
A high level price comparison indicated that we could use a modern generation of
the same instance family and still benefit from a cost saving.
First steps
Head on over to Amazon’s Elasticsearch service to get started. There is a free tier that you can use to take things for a spin. The web interface will walk you through getting a domain up and running. For the purposes of this demo, the following CLI snippet will create a small instance within your specified VPC, running Elasticsearch 7.1. Tweak this as needed, or create using the web interface.
aws es create-elasticsearch-domain \
  --domain-name YOUR_CHOSEN_DOMAIN \
  --elasticsearch-version 7.1 \
  --elasticsearch-cluster-config InstanceType=t2.small.elasticsearch,InstanceCount=1 \
  --ebs-options EBSEnabled=true,VolumeType=standard,VolumeSize=10 \
  --vpc-options SubnetIds=SUBNETID,SecurityGroupIds=SECURITYGROUPID \
  --access-policies '{"Version":"2012-10-17","Statement":[{"Effect":"Allow","Principal":{"AWS":"*"},"Action":"es:*","Resource":"YOUR_ARN"}]}'
Use your own subnet id, security group id, and domain arn.
Full CLI reference
here
Agent setup
Now that you have a running ES domain, the next thing to do is to have your source server(s) send their logs to elasticsearch. One notable quirk to getting this working on AWS is that you must install the OSS package of filebeat. If you install the regular one, you will have xpack authentication issues.
These are the steps required to install OSS filebeat on a Ubuntu machine.
wget -qO - https://artifacts.elastic.co/GPG-KEY-elasticsearch | sudo apt-key add -
sudo apt-get install apt-transport-https
echo "deb https://artifacts.elastic.co/packages/oss-7.x/apt stable main" | sudo tee -a /etc/apt/sources.list.d/elastic-7.x.list
sudo apt-get update && sudo apt-get install filebeat
The filebeat configuration file is located at /etc/filebeat/filebeat.yml.
In here we need to set the host addresses for Elasticsearch, Logstash, and Kibana.
Once you have set the hosts, make sure to enable the log input.
#=========================== Filebeat inputs =============================
filebeat.inputs:
# Each - is an input. Most options can be set at the input level, so
# you can use different inputs for various configurations.
# Below are the input specific configurations.
- type: log
  enabled: true

  # Paths that should be crawled and fetched. Glob based paths.
  paths:
    - /var/log/*.log
Now we can enable the system module (for gathering syslogs), and start the service.
sudo filebeat modules enable system
sudo service filebeat start
Logs should now be getting shipped to Elasticsearch by Filebeat.
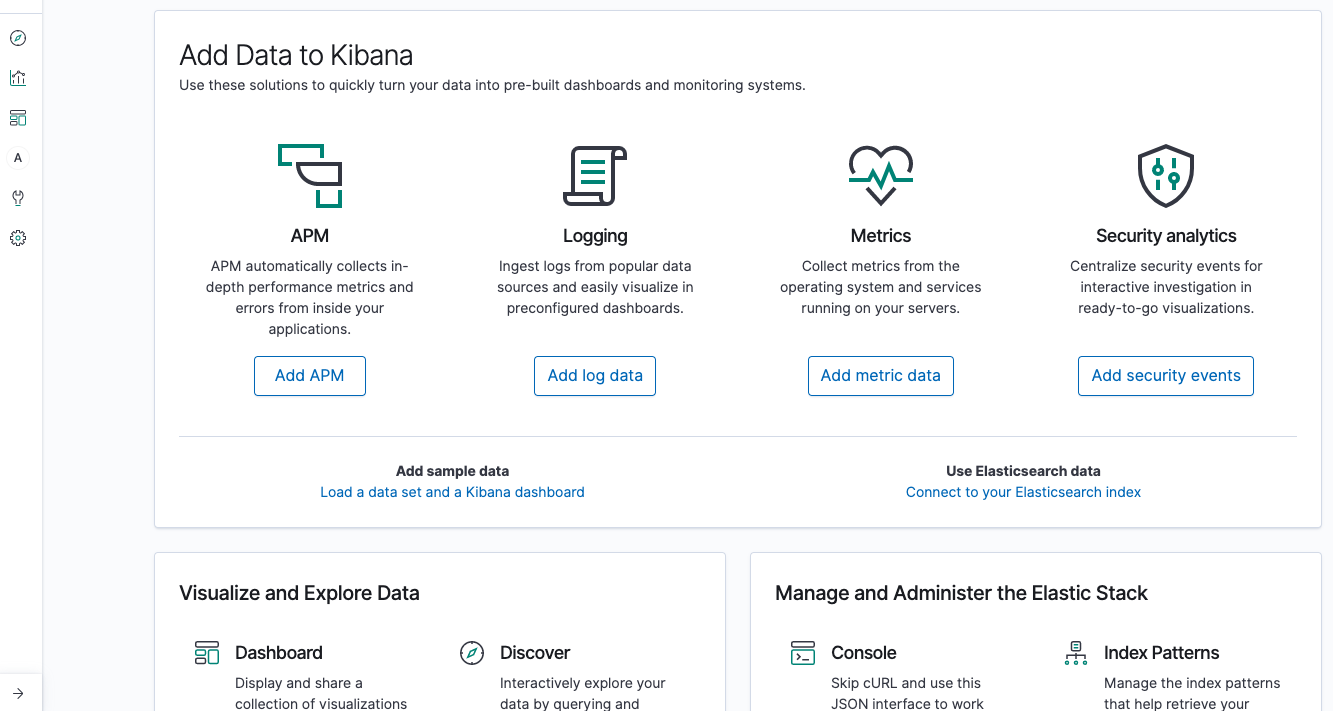
Kibana
Your Kibana endpoint is displayed on you Elasticsearch domain page on AWS. During setup, Filebeat will have created some dashboards. Your syslog metrics will now be getting indexed and will be searchable.
To add more data to Elasticsearch, such as application metrics, or database logs, the Kibana dashboard provides simple instructions on enabling the various different shippers.
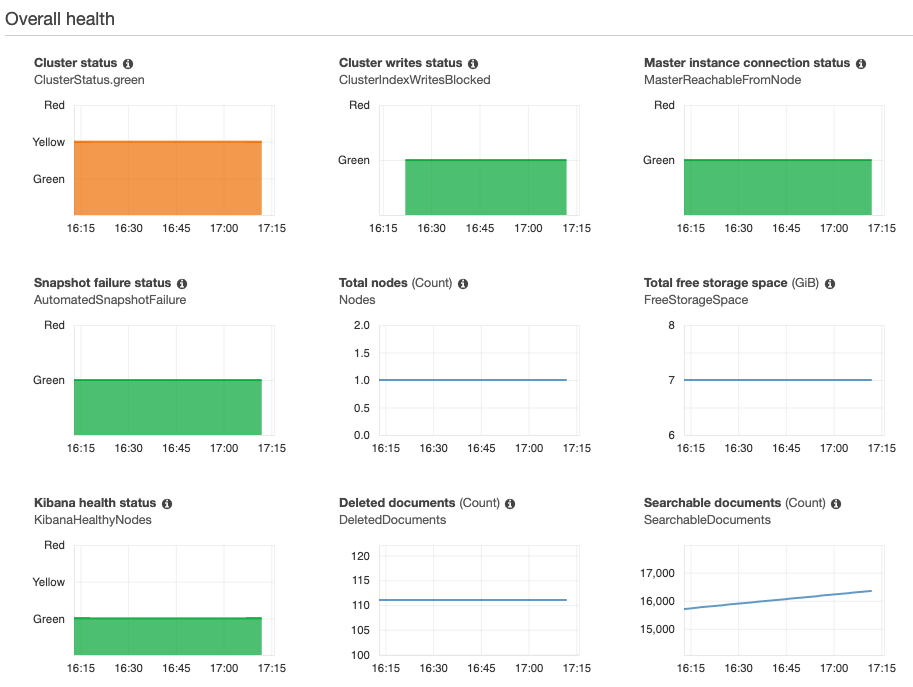
Monitoring
Out of the box, Amazon provides you with a broad range of metrics on your
domain/cluster. Here’s a quick peak at the dashboard for our test instance.
You can see the remaining storage, nodes in the cluster, number of indexed
documents etc.
We are still in the process of rolling out the Elastic stack to replacing our ageing self-managed ELK stack. Looking forward to diving deeper, and I’ll write up some more notes and findings as we go.