Using Kanban to Surface Problems
Background to Kanban
Kanban has its origins in Japan, in a Toyota factory. It was developed in response to Toyota’s poor performance relative to their American competitors. Toyota plants frequently suffered delays and quality issues that led to its negative reputation.
The word itself, Kanban, means signal, and was designed to provide a visual overview of the entire value chain, from demand to supply, highlighting any bottlenecks in production, or illustrating other problems such as an increased defect rate, or too much unfinished work.
“The aim of Kanban is to make troubles come to the surface.” - Taiichi Ohno.
Once problems became visible, Toyota were able to quickly identify them and fix them. Just-in-time production helped to minimize waste, and continuous improvement kept Toyota striving for better. As a direct result, the bar was constantly raised until it greatly exceeded the competition, and now, Toyota has a reputation for delivering high quality products on time. “… the best built cars in the world”.
Sidenote: Somewhere between 30% and 50% of the neurons in your brain are dedicated to visual processing. As humans, we can process more information by looking at imagery than by text alone. A picture tells a thousand words.
The following section looks at the picture of software development, and explains why visualising problems makes them easier to comprehend and hone in on.
Kanban in Software Development
When delivering software, most teams will use a board such as Trello, or Zenhub, or even sticky notes on the wall, to observe their work-in-progress and the upcoming roadmap.
This provides an overview of task progress, and a level of transparency to stakeholders, who can, at a glance, see what stage their request is currently at. In addition to transparency for lead time, by visualising work, teams can follow Toyota’s lead and see how their delivery flows.
Remember that a high performing engineering team should deliver a constant flow of value.
In keeping with the original aim of the system, we need to leverage our Kanban boards to help surface any problems.
In her book, Making Work Visible, author Dominica DeGrandis identifies five problems in software development that can be surfaced using Kanban. She refers to these as the five “Time Thieves”. The remainder of this post will discuss each in a little more detail, but the list is
- Too Much WIP
- Unknown Dependencies
- Unplanned Work
- Conflicting Priorities
- Neglected Work
Each of these problems are preventing your team from getting work done to the very best of their abilities. Fortunately, each can be measured and fixed. Let’s dive a little deeper into each.
Too Much WIP
Problem
WIP stands for Work in Progress, and refers to any work that has been started but not yet finished. Usually denoted by a card or task in the “Doing” or “In Progress” column.
Having too much incomplete work leads to a number of problems. The lead time (the time taken from customer request, to customer delivery) will increase. The quality of the delivered work can suffer due to engineers being required to context switch between tasks. The cycle time (the time taken from an engineer picking up a piece of work, to completing it) will also increase.
The relationship between WIP and cycle time is described by adapting Little’s Law. Little’s Law states that
AVG CYCLE TIME = AVG WIP / AVG THROUGHPUT.
Put simply, higher WIP means that other work sits idle for longer.
Solution
Tackling too much WIP is actually quite simple. Stop taking on work. To borrow a quote from the authors of Kanban In Action
“Stop Starting, Start Finishing”.
The Kanban mechanism for implementing this is to use a WIP limit.
WIP limits are a limit on the number of items that can be in progress at the same time. Most often, limits are set at the top of the column, but in some cases, you may want to set limits per swimlane, or per service-class (bug/urgent/feature etc).
Items can be pulled into a column provided that the limit will not be breached. NB: The usage of pull instead of push is signifigant, and illustrates how work is pulled into progress when there is capacity, and not pushed in simply because there is demand.
There is no elixir-vitae for what the limit itself should be, and it’s important to recognise that you may not get this 100% right the very first time, but as a starting point, a rule of thumb can be one item per engineer, and a small bit of wiggle room. Adjusted appropriately for pair programming.
Use the WIP limit to apply the necessary traction to the system that enables people to finish work.
Another sidenote: It is incredibly important that all work is visible on the board. Invisible work has a high cost and this needs to be made visible to all. A helpful way to highlight this type of work is to ask the following question at standup. “Is anybody working on something that is not on the board”? If so, this work needs to be categorised and made visible.
Unknown Dependencies
Problem
We want our engineering teams to be as autonomous as possible. A stream-aligned team is one that is aligned to a single value stream. A stream being a continuous flow of work or value to a business domain.
In an ideal world, a team is fully empowered and enabled to deliver streams of value end to end. In a non-ideal world, however, there are typically a number of dependencies along the way. This is often what leads to missed deadlines and delivery delays.
“Every dependency doubles your chance of being delayed or late” - Troy Magennis.
For the arithmetic fans, this translates to 2n (two to the power of n, where n is the number of dependencies).
I recently read about an awesome way to visualise the chance of success for dependencies using a basic boolean logic table.
In the following table, we are visualising a three dependency chart. Three teams required to deliver a piece of value. Green cells indicate success, and white indicate failures (delays, or bugs etc).
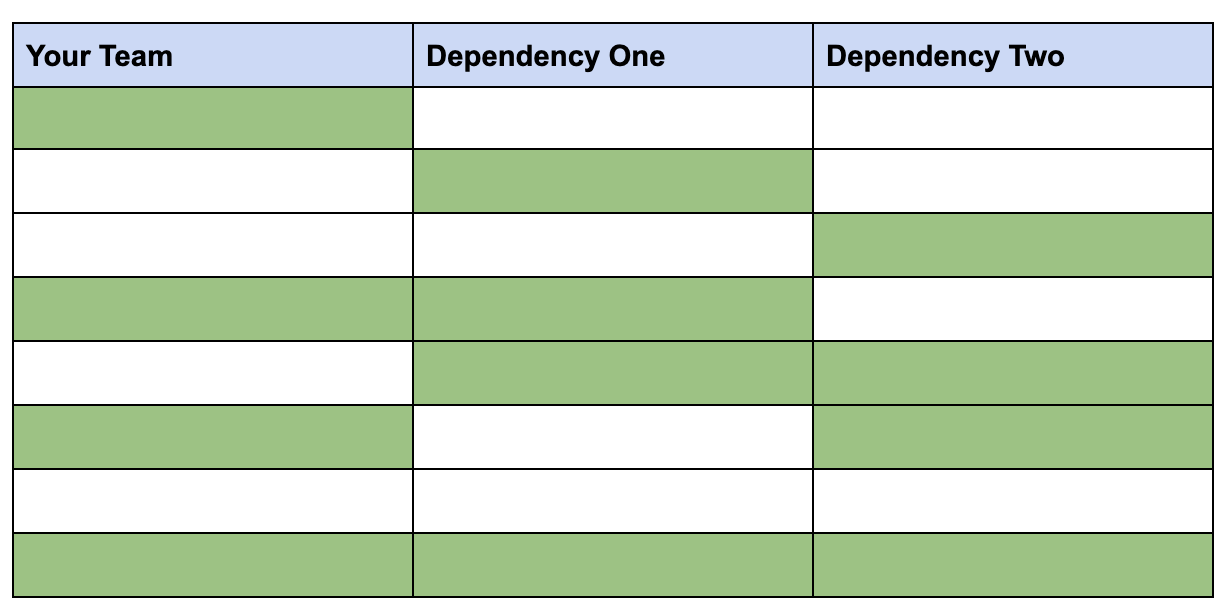
The table clearly shows the different permutations that can come into play. In this scenario, with just three dependencies, there is only a 12.5% chance of success (the last row).
So now that we know the problems with dependencies, what should we do is make them visible.
Solution
The solution, or partial solution, for handling dependencies is to ensure that they are highlighted and communicated upstream, so that we can work towards reducing/removing them. There’s definitely no silver bullet for this, but by tagging work that is blocked on a dependency, we can start to quantify the pain-points, and use this as leverage to realign the team boundaries, or to equip the team with the skills required to fulfil the dependency contributions.
For example, if the work items spend the greatest portion of their lifecycle waiting for designs, then we need to quantify the increased value opportunity that could be recognised by the addition of a design resource to the team.
In addition to using labels, another option is to use a swimlane for tasks with dependencies. This can be particularly useful if you run reports at the swimlane level.
Unplanned Work
Problem
Unplanned work is one of the biggest causes of unpredictability to the flow of work. If you lose predictability, then your expectations on delivery can be thrown out the window. Without predicability, there’s no way to confidently answer your customer’s first question; “When will it be ready?”.
Unplanned work comes in a variety of shapes and sizes, but typically it presents itself in the form of something on fire, or an imminent deadline that ‘can’t be missed’. Whatever the form, it is something that was not accounted for, then that eats into your planned work.
Your planned work is your value add,… your raison d’etre.
Solution
I’ve wrote about buffering before in the context of Scrum sprints, and really, the solution here is much the same. Acknowledge that shit happens, that things will fall over, and incidents occur. Once you accept that these things will happen, then you need to plan for it, by adding capacity to the system.
How much capacity to add? Well, similar to choosing WIP limits, it depends.
Start by looking at how much time was spent on unplanned work in the last week or month. Now, budget for that amount. If you are having problems quantifying past unplanned work, don’t worry about it. Start tracking it going forward.
Perhaps use a high-level label like “Unplanned” for incoming items, or use a different coloured sticky note. Of course, adding more granularity will help you to focus your future efforts on particular problem areas. For example, if 75% of unplanned work was giving CPR to a dying DB, then replacing/fixing that DB should bump up the backlog priority.
With regards to your Kanban visual control, you can use swimlanes or labels to visualise unplanned work. Monitor this over time, and reduce it as best you can. Another common mechanism is to introduce an ‘Expedite’ swimlane, with its own upper limit. Use this only for actual emergencies that need urgent attention.
Conflicting Priorities
Problem
When everything is top priority, nothing is top priority.
Conflicting priorities directly causes too much WIP as people are not sure what to be working on. Incoming tasks, with perceived higher priority, take precedence over tasks in progress, and this pushes up the cycle time. Increased cycle time leads to unhappy stakeholders.
Another problem with this, is the need to context switch from task to task. I’ve written previously about the perils of context switching, but in a nutshell, every time you switch to a new task, there is a cost. The cost is the effort expended to reposition yourself into the previous train of thought. Take a look at the table below.
| Number of simultaneous projects | Percent of time available per project | Loss to context-switching |
|---|---|---|
| 1 | 100% | 0% |
| 2 | 40% | 20% |
| 3 | 20% | 40% |
| 4 | 10% | 60% |
| 5 | 5% | 75% |
This clearly highlights the dangers of trying to juggle tasks. By definition, there can only be one most important thing. Make it known.
Solution
The solution to conflicting priorities is to ensure that the whole team is fully aware of the priorities by i) establishing and communicating a prioritization strategy, and ii) ordering your backlog to accurately reflect the priority of tasks. It should be crystal clear that the next piece of work to be picked up is the next most important one, and it will be crystal clear if it sits at the very top of the backlog.
The backlog should be a single source of truth. Avoid multiple backlogs (or backlogs per swimlane e.g features, tech debt, bugs). Multiple backlogs will cause conflicting priorities.
Invest heavily in your planning sessions. Team members not only need to know what to do, but more important, why they are doing it. What is the value add? What are we achieving by completing this task? Why is this piece of work more important than another?
Determine what works best for your team, but the goldilocks of planning cadence is often referred to as just-in-time planning.
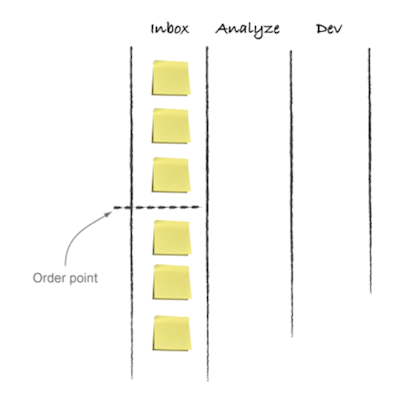
Just in time planning happens just when it’s needed. It helps to prevent planning too far in advance (less agile), and planning too often (meeting overload). Kanban in Action illustrates a simple way of doing that.
Place an ‘Order point’ in your backlog. In this example, the Inbox column represents the backlog. The team pulls work into play until it reaches the order point. Once reaching the order point, the team contacts the product manager or relevant stakeholders to organise another planning session. The team can continue to work unblocked in the meantime.
Neglected Work
Problem
Neglected work lingers around consuming space and bandwidth. Quite often it is invisible, ignored up until the point that it becomes a fire. Usually, the most common type of neglected work is technical debt, bugs/defects, quality improvements, upgrades etc. The less sexy the task, the more likely it is to be neglected.
“Let’s just ship what we have and we can clean it up when we have more time.”
We all know how that goes. Neglected work can often go hand in hand with too much WIP and conflicting priorities.
Solution
Again, the solution for neglected work is to ensure that it is fully visible to all. If we can see it, then we can address it.
The lifetime of items in each state will be different for each project, but in an ideal scenario, work items should flow at a constant rate, such that they do not spend a disproportionate amount of time in a column. Items languishing in a column are becoming neglected.
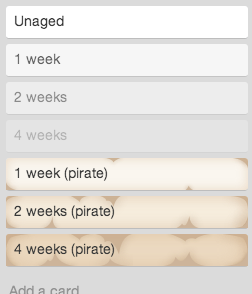
The simplest way to highlight this is to display the age (hours, days, weeks, whatever is your norm) on the items. Make it clear and visible. If you use sticky notes, then perhaps use a system akin to the one that prisoners use for counting days in prison. Append a line and cross it off when it reaches a week. I’ve used a plugin for Trello that ages cards on the board. The older the card, the more haggard it looks. This is a really quick way to visually signal something that needs attention.
Whatever the method, the outcome is the same, highlighting the problem by making it visible. Ageing items can also be nuked if appropriate. Kill them if they are no longer relevant.
How to Implement the Solutions
Every solution addresses the problem using the same method. Highlight the area of interest and make it visible. Let your Kanban board paint the picture for you. This is what it was designed to do.
As with all things, there’s no need to dive in and overhaul your entire system. Pick one area and tackle it. Embrace continuous improvement. The rate of flow can always be increased.
Use metrics to assess performance over time. Some tools like Jira and Zenhub will make metric reporting a little easier than others, but as you will have read, most of these metrics and signals are simple and can be tracked on a spreadsheet.
Optimise for flow and maximum productivity, by removing waste in the system.
Additional Reading
I’ve been reading and discussing Kanban quite a bit recently. If you would like to learn more about Kanban, I would recommend Kanban In Action, Making Work Visible (upon which this post is based), and Actionable Agile Metrics for Predictability.